NESO data
Statistical views and tools built on public NESO data.
A small catalogue of tools and reference material built on publicly available NESO data. Three sub-areas sit below - a planned frequency-statistics tool, live historical-trend views built on GC0105 / GC0151 incident reports, and a general-purpose interface to the NESO Data Portal.
The AI aspect of this piece of the work is a custom API interface developed to connect to the NESO data portal to allow data to be retrieved directly from the system operator, allowing for easy dissection, review and analysis. The AI approach here is somewhat more complex as using an AI to directly process large datasets (each NESO monthly frequency data set is circa 75Mb), becomes context heavy and a massive token burner. Instead I used the AI to develop software tools to analyse and parse the data in a structured method into trend data that the AI could then review and used to extrapolate patterns of behaviour.
Frequency data
1Statistical view of GB system frequency.
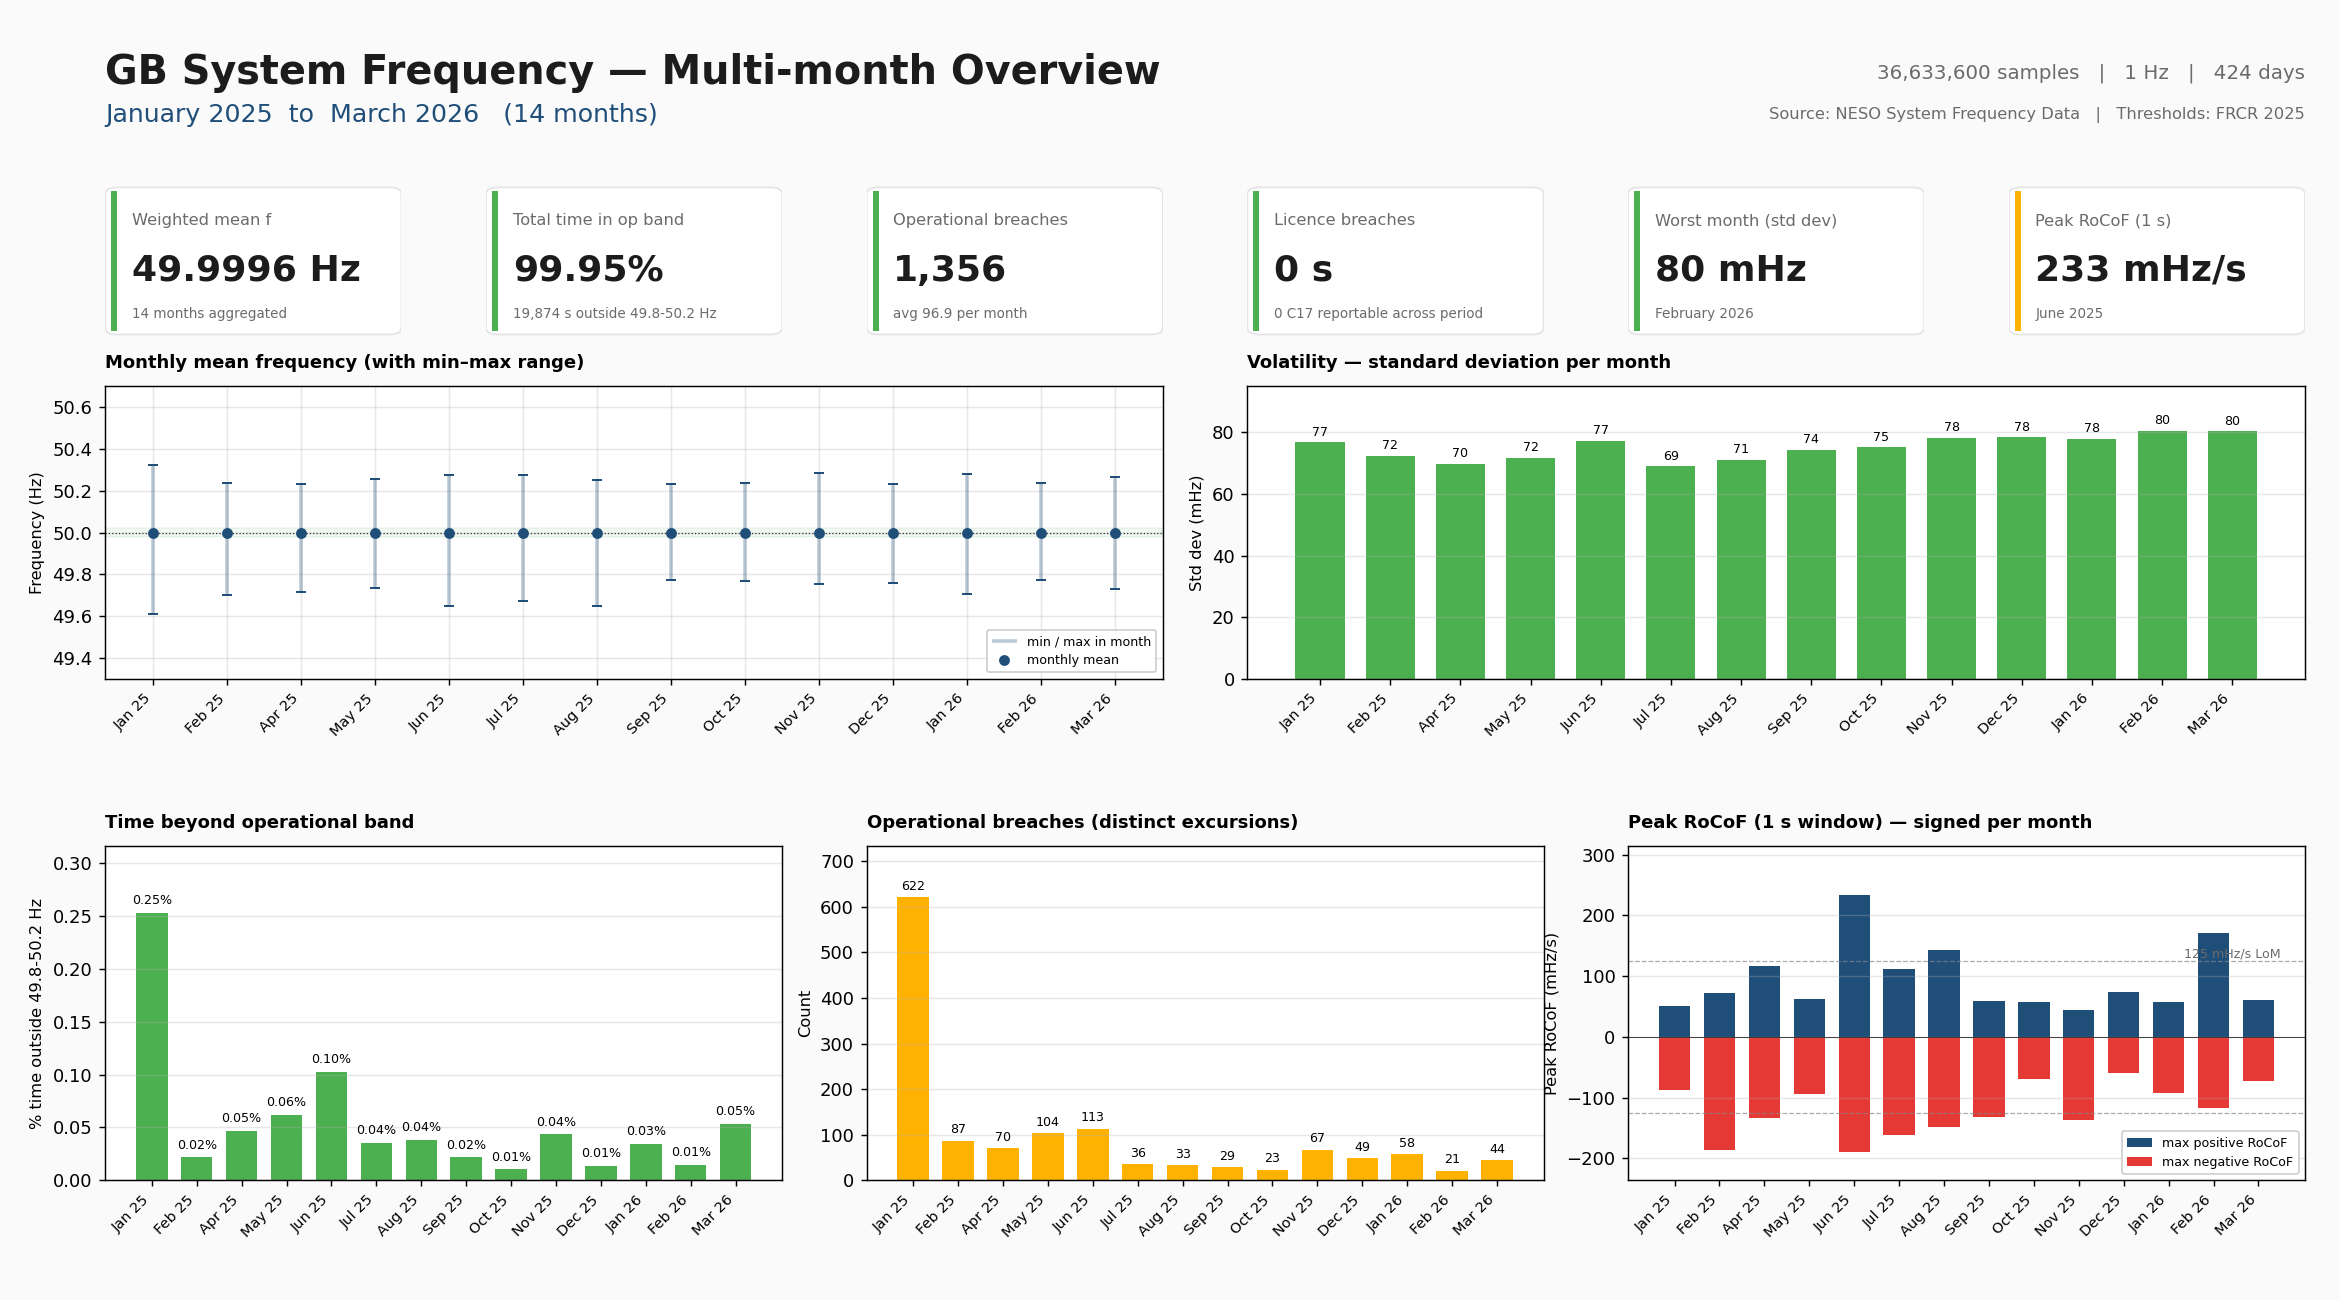
A statistical view of GB system frequency built from NESO’s 1-Hz public dataset. Each month is rendered as a single dashboard showing the per-minute envelope, the frequency distribution and diurnal profile, and time spent outside operational and statutory bands. Step through the months in the carousel below - the window currently runs from January 2025 to April 2026 and refreshes as new monthly CSVs are published.
The dashboard uses the FRCR thresholds for the colour banding: the operational band is 49.8–50.2 Hz, the statutory licence limits are 49.5–50.5 Hz. Across the whole window the grid sat inside the operational band more than 99.9% of the time and never breached the statutory limits - the interesting structure is in the tails, the short excursions, and the seasonality.
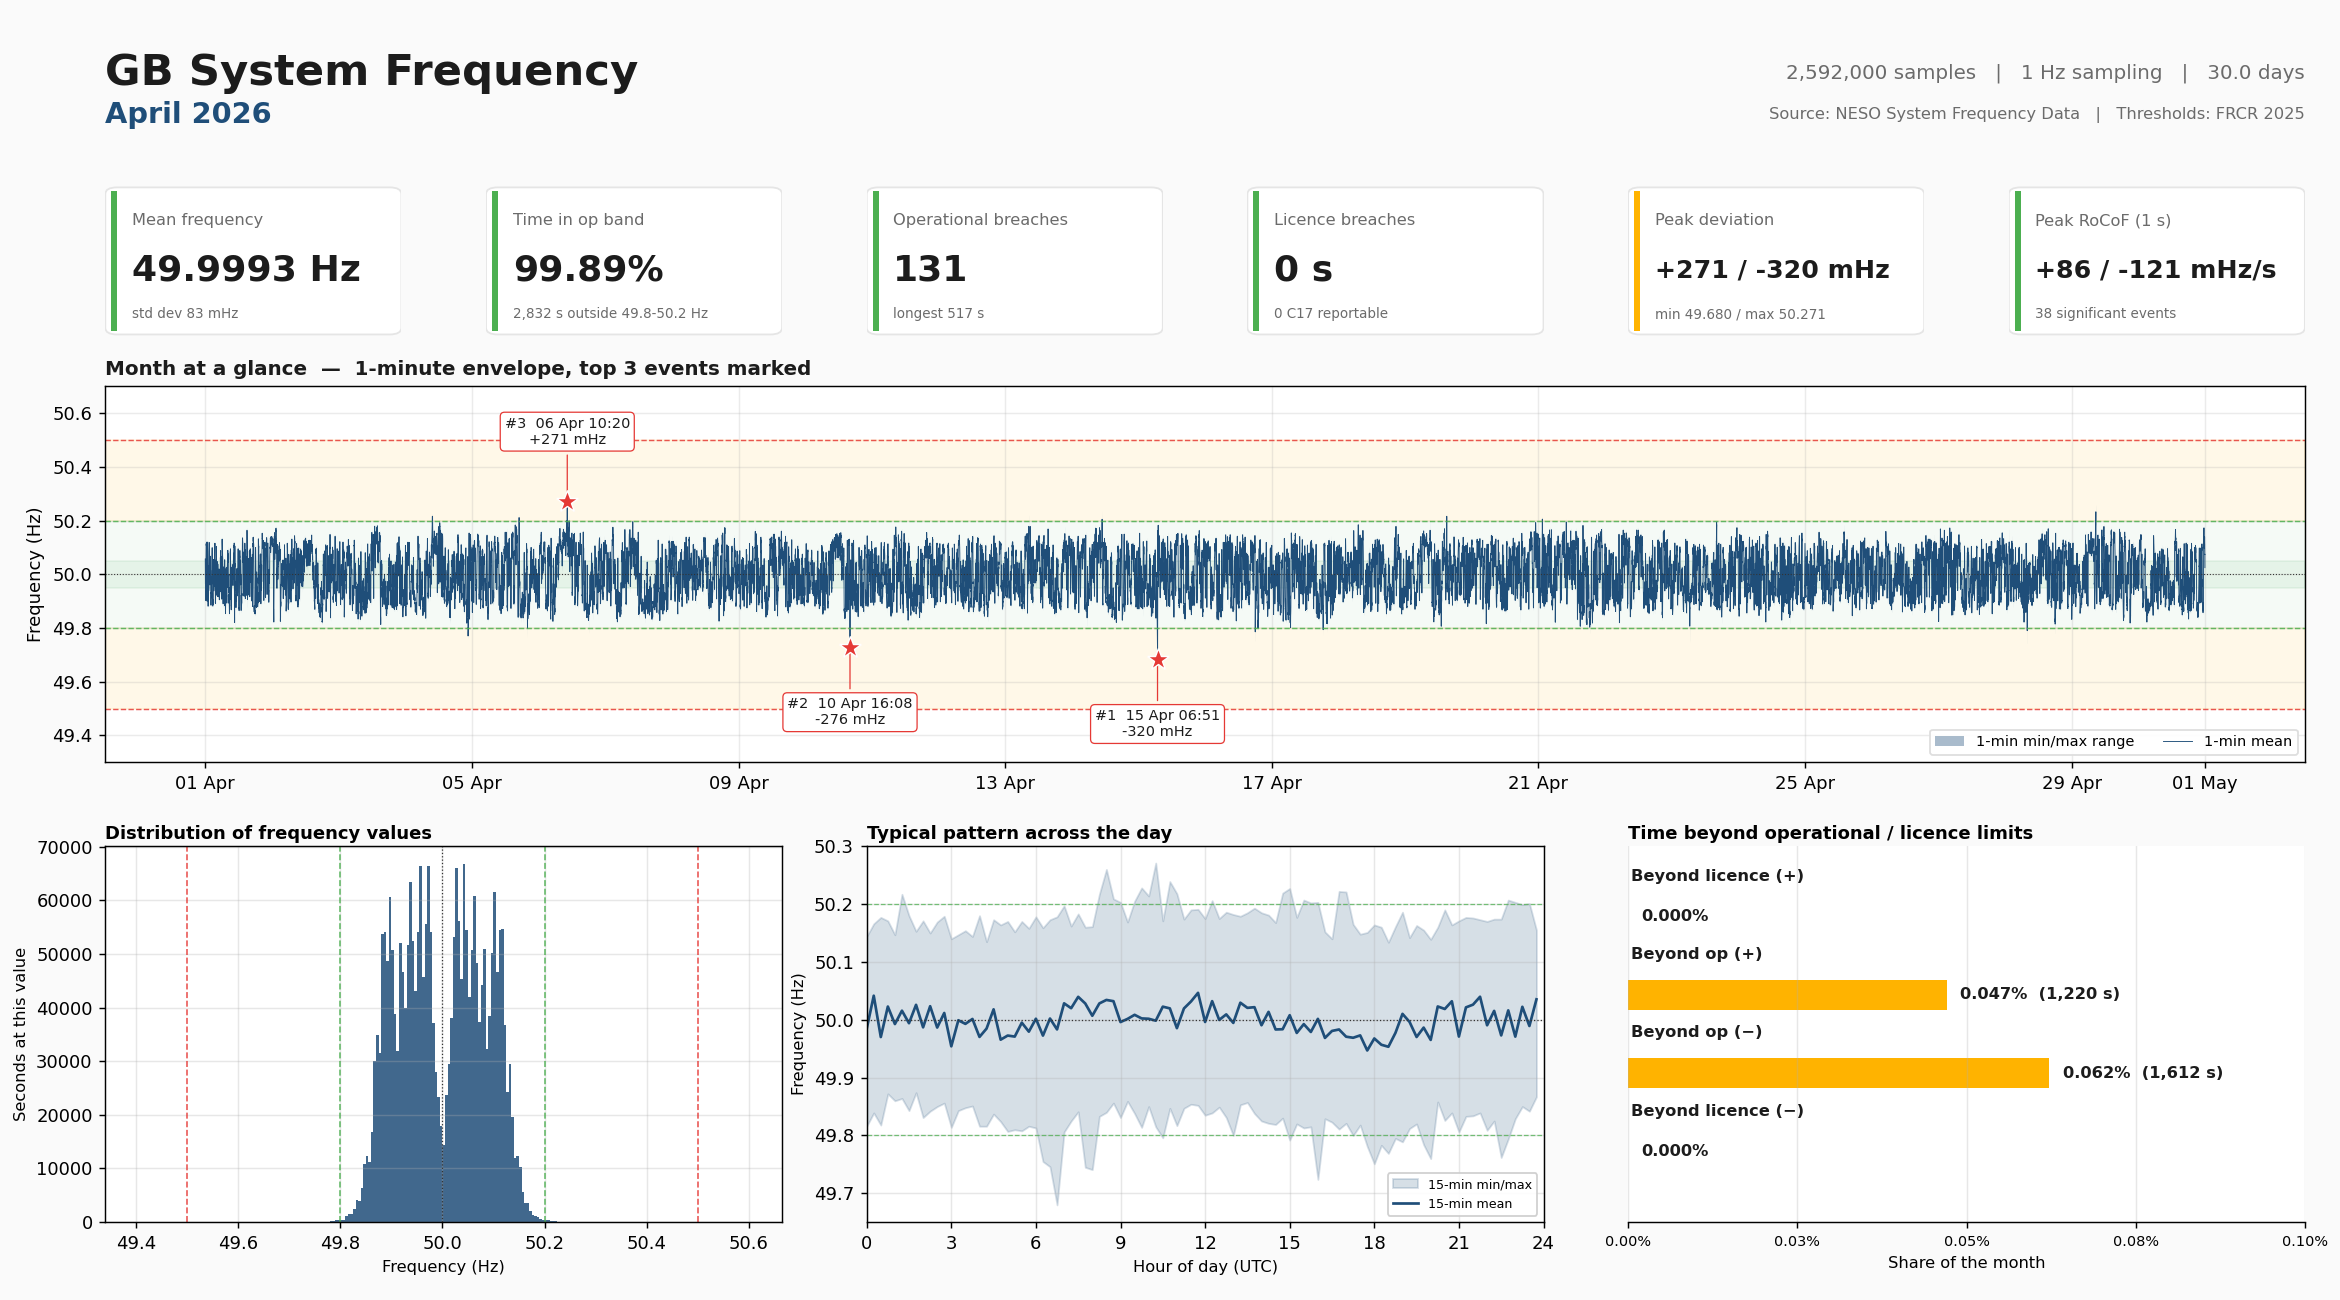
Looking across the whole period (Jan 2025 → Apr 2026), the grid stayed inside the operational band the vast majority of the time and never breached statutory licence limits. One month stands out - January 2025 - with roughly three times the operational-excursion count of any other month in the window.
Historical trends
2GB system incidents and transmission faults - Dec 2024 to Apr 2026.
Live view derived from NESO’s monthly GC0105 (system-incident) and GC0151 (transmission-fault) reports. The underlying pipeline ingests the raw .xlsx files, extracts per-event frequency, RoCoF and inertia figures, and produces the summary tables and plots shown below.
Four themes surfaced in the current dataset: which circuits are faulting most, what impact events have on system frequency, what system inertia looks like at the time of incidents, and how often contingent events (multiple incidents close in time) occur.
What these numbers mean
A few of the numbers in the row above are worth lingering on:
- 157 incidents is roughly one every 3 days - sustained background rate of “something tripped today.”
- Worst nadir 49.611 Hz stayed comfortably above the 49.5 Hz statutory floor, but only by ~110 mHz. That’s the headroom the system runs with.
- 1877 MW is the largest single-event loss in the window - well above the historical 1320 MW infeed-loss design basis. Modern frequency response is sized for events like this, but it’s a useful upper bound for what the system actually sees.
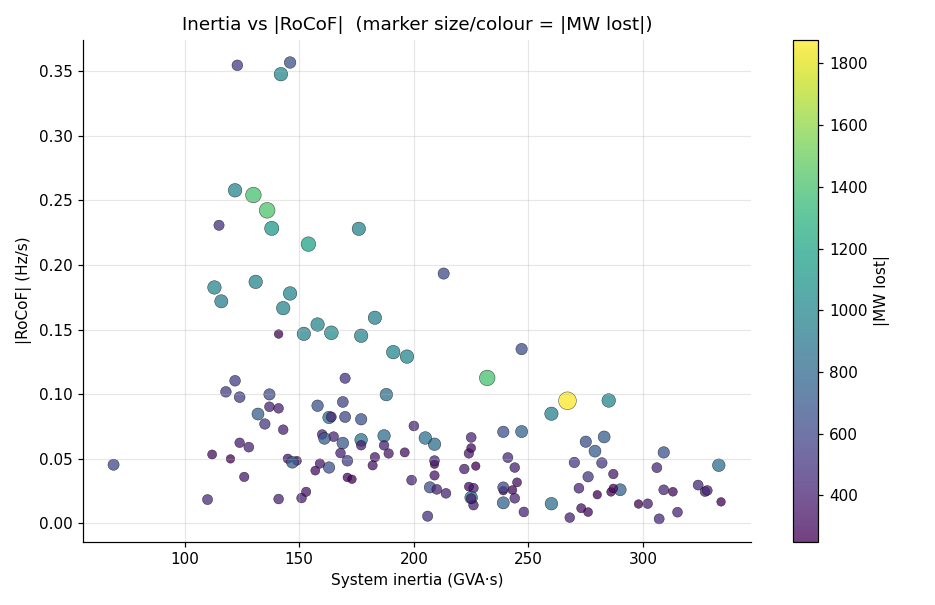
- |RoCoF| 0.357 Hz/s at 146 GVA·s of inertia matches the swing-equation prediction (Δf/Δt ≈ ΔP / 2H·S). The RoCoF and inertia numbers in the same row are not independent - that’s the −0.52 correlation captured next.
- r = −0.52 between inertia and |RoCoF| for large events is moderate, not strong. The weakness comes from frequency response acting during the RoCoF window, governor inertia, and measurement noise. The signal is real; it’s just not the whole story.
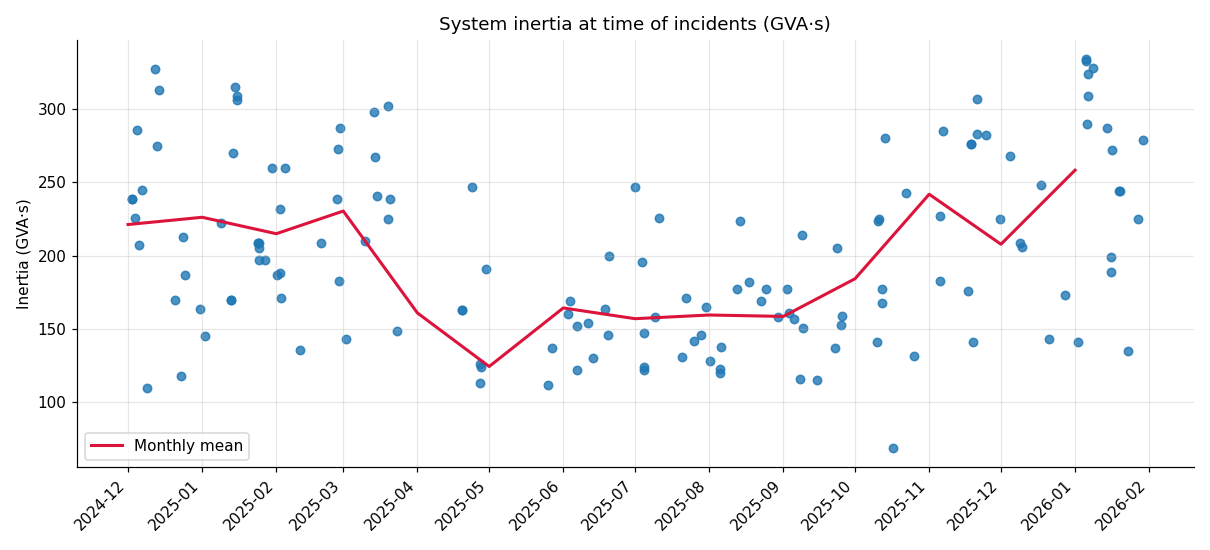
- Inertia range 69 – 334 GVA·s is a 5× spread. The summer low-wind months sit near the bottom of that envelope - the same months where excursions happen on a smaller MW loss because the system’s sensitivity to it is higher.
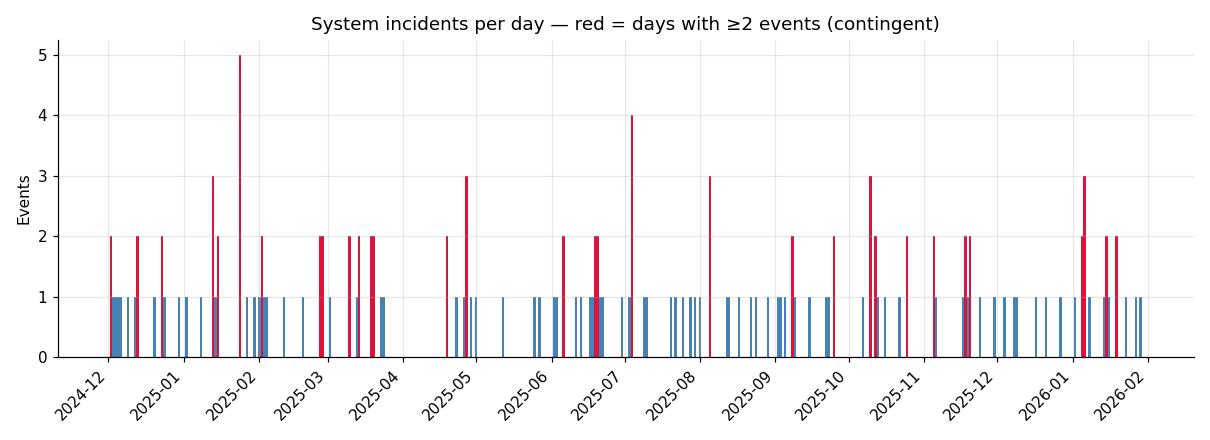
- 7 contingent clusters covering 14 events means about 9% of all incidents arrive within an hour of another. Storm Éowyn’s 24 Jan 2025 day alone accounts for five.
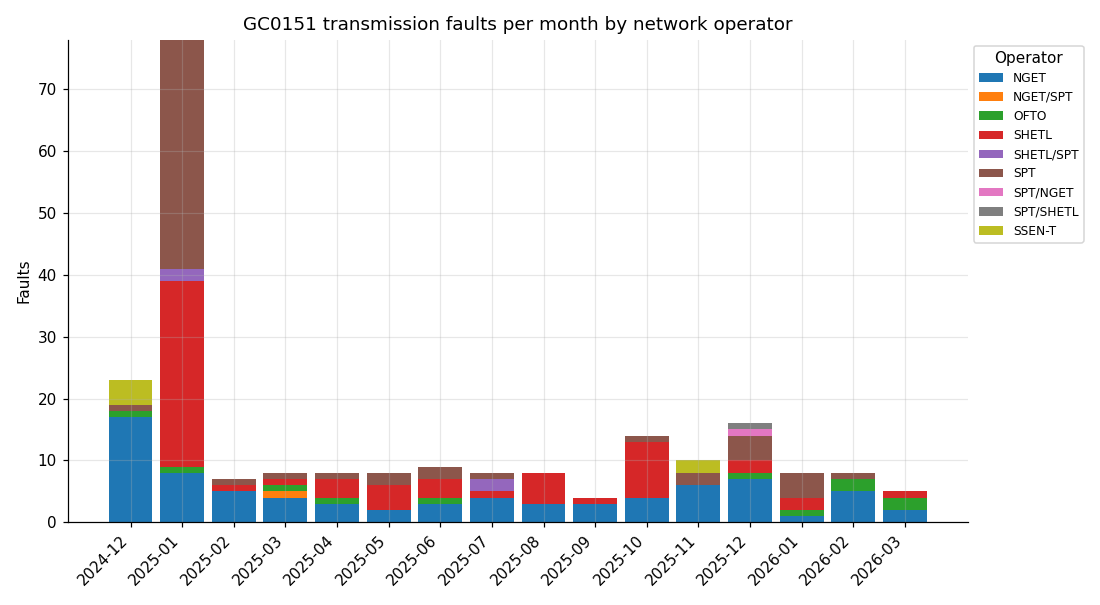
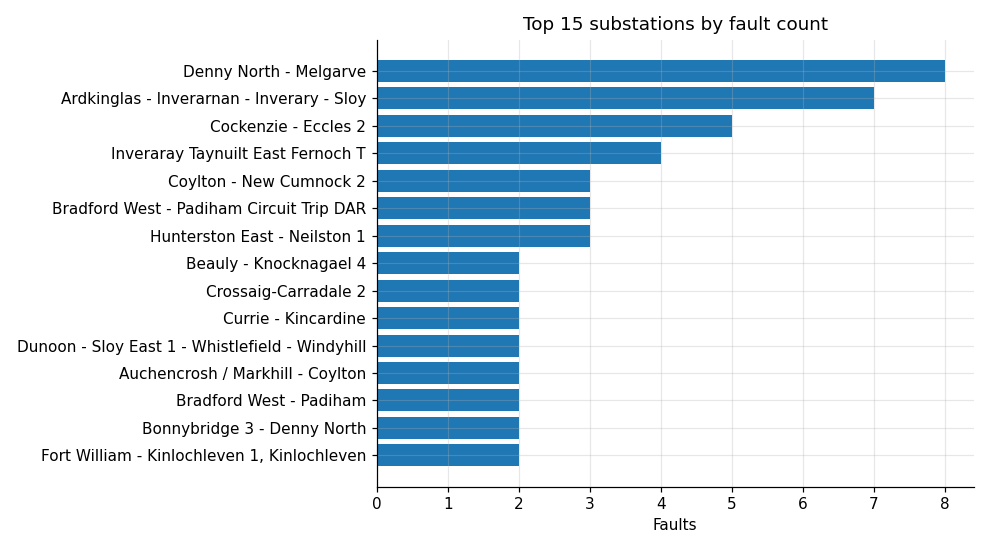
Theme 1 · What circuits are faulting
Transmission faults by month, split by network operator. NGET dominates the volume by count; the Jan 2025 spike (78 faults versus the typical 8–15) is Storm Éowyn. Below: the circuits appearing most frequently as fault locations across the whole window.
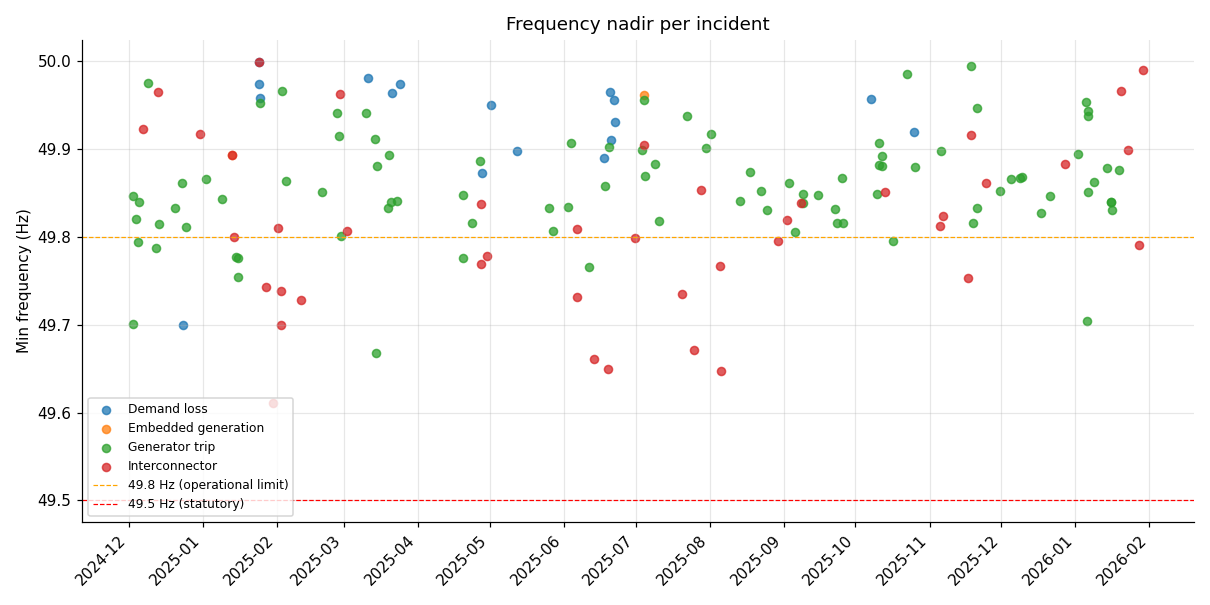
Theme 2 · Frequency impact
Frequency nadir over time for each system incident. The 49.8 Hz and 49.5 Hz reference lines give a quick read on which events ran through operational and statutory envelopes. Most events stay inside ±0.2 Hz; the tail of deeper excursions is where the interesting engineering questions sit.
Theme 3 · System inertia at the time of events
System inertia at the time of each incident, plus an inertia-vs-|RoCoF| scatter for larger events (≥400 MW loss). The Pearson correlation across those is −0.52 - a clean signal that lower inertia produces steeper RoCoF, as expected from the swing-equation. A seasonal pattern shows through in the inertia-over-time plot, with summer months sitting noticeably lower.
Theme 4 · Contingent events
Days with two or more system incidents within 60 minutes, flagged separately on the per-day bar below. The current window has seven such clusters covering fourteen events; Storm Éowyn’s 24 January 2025 day alone accounts for five. Contingent events matter disproportionately for operability - two medium-sized trips close in time can strain the system more than one large one.
Download raw data
CSV snapshots of the processed dataset.
Current snapshot covers December 2024 to April 2026. Refreshes when new monthly GC0105 / GC0151 reports are published.
NESO API
3General interface to the NESO Data Portal.
A static, interactive dashboard built directly on top of the NESO Data Portal’s CKAN API. Grouped into five themes - system load, generation mix, ancillary-service requirements, EAC procurement, and Demand Flexibility - covering roughly fourteen individual panels at half-hourly or EFA-block resolution.
Data refreshes monthly. A single build script pulls every source CSV from the Data Portal, geocodes new provider postcodes, and bakes the charts into a self-contained HTML page with no runtime calls - so it serves as a pure static asset from Cloudflare.